When visualizing time-series data on a serial chart, in the Category field drop-down list, you need to choose the field that contains the time stamps. These time stamps can be stored in fields of date, string, or numeric type. For best performance, it is recommended that you store your time stamps in a date field type. You can convert string or numeric fields containing time stamps to date fields using the Convert Time Field tool. If you choose not to convert your string or numeric fields into date fields, you can indicate that these fields contain date values and allow Dashboards to parse the time stamps into dates using the parse dates setting.
Parse dates
On the Data tab of your serial chart's configuration, enable the Parse dates toggle button.

The date settings that appear for parsing dates depend on the type of category field chosen. A field's data type is displayed beside the field name in the Category field drop-down list.
If the data type of the field is date, no formatting information is required, and only the Minimum period setting is available. If you choose a numeric or string field, you will see the Minimum period setting and the Parsing pattern setting. The pattern you choose determines the format of your time stamps after being parsed into dates. The time stamps in your data must be stored in the same format you choose for the Parsing pattern setting. The available patterns depend on whether the field type is numeric or string.
Numeric field type
If the field type is numeric (for example, Short, Long, Float, or Double), the following standard numeric time formats are provided in the Parsing pattern drop-down menu:
- yyyy
- yyyyMM
- yyyyMMdd
- yyyyMMddHHmmss
String field type
If the field type is string, the following standard string time formats are provided in the Parsing pattern drop-down menu:
- yyyy
- yyyyMM
- yyyy/MM
- yyyy-MM
- yyyyMMdd
- yyyy/MM/dd
- yyyy-MM-dd
- yyyyMMddHHmmss
- yyyy/MM/dd HH:mm:ss
- yyyy-MM-dd HH:mm:ss
- yyyyMMddHHmmss.S
- yyyy/MM/dd HH:mm:ss.S
- yyyy-MM-dd HH:mm:ss.S
- yyyy-MM-ddTHH:mm:ss.S
Minimum period
The minimum period setting determines how time specific the chart categories can be. The options for minimum period are as follows:
- Second
- Minute
- Hour
- Day
- Month
- Year
For instance, in the following chart, the minimum period is set to Month. This means that the minimum time period on which a category in this chart can be based is a month, rather than a day, an hour, a minute, or a second.

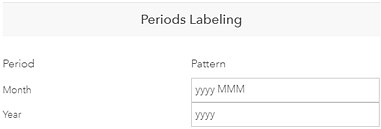
When the minimum period is set to Month, it also means that a chart category can be based on time periods that are longer than a month, such as a year. Dashboards bases categories on time periods that are longer than the minimum period if there is a high density of data categories based on the minimum period. This avoids displaying labels for each category and creating visual clutter. This means that the minimum period setting also impacts which period labels you can specify patterns for on the category axis. You can't specify patterns for shorter time periods than the one you choose for the minimum period, but you can specify patterns for longer time periods than the one you choose. For example, if the minimum period is set to month, you can't specify a pattern for day labels, but you can specify a pattern for year labels.

For more information about how to specify patterns for period labels, see Format dates.
Serial charts that have parse dates enabled, and are either a line or smoothed line chart, have the option of connecting gaps caused by missing data points. In the Series tab of your serial chart's configuration, use the Connect gaps toggle button to connect or create breaks in your chart where there are missing data points such as empty values for that time period.